In the last days, I am running a number of tests based on the TPC-DS benchmark against Oracle’s Autonomous Data Warehouse Cloud service (ADWC). One of the first thing I did is of course to create the TPC-DS schema and populate it. The aim of this blog post is to share some observations related to the population step.
I started by generating the data with the tool provided by TPC-DS: dsdgen. With the following command, I generated 1TB of data:
$ dsdgen -scale 1000 -dir /data/tpcdsdata |
The tool generated, in about 24 hours, the following files:
$ ls -1s --block-size=M /data/tpcdsdata/ *.dat
     1M /data/tpcdsdata/call_center.dat
     5M /data/tpcdsdata/catalog_page.dat
 22375M /data/tpcdsdata/catalog_returns.dat
302796M /data/tpcdsdata/catalog_sales.dat
   642M /data/tpcdsdata/customer_address.dat
  1560M /data/tpcdsdata/customer.dat
    77M /data/tpcdsdata/customer_demographics.dat
    10M /data/tpcdsdata/date_dim.dat
     1M /data/tpcdsdata/dbgen_version.dat
     1M /data/tpcdsdata/household_demographics.dat
     1M /data/tpcdsdata/income_band.dat
 16373M /data/tpcdsdata/inventory.dat
    83M /data/tpcdsdata/item.dat
     1M /data/tpcdsdata/promotion.dat
     1M /data/tpcdsdata/reason.dat
     1M /data/tpcdsdata/ship_mode.dat
     1M /data/tpcdsdata/store.dat
 34016M /data/tpcdsdata/store_returns.dat
399328M /data/tpcdsdata/store_sales.dat
     5M /data/tpcdsdata/time_dim.dat
     1M /data/tpcdsdata/warehouse.dat
     1M /data/tpcdsdata/web_page.dat
 10349M /data/tpcdsdata/web_returns.dat
151044M /data/tpcdsdata/web_sales.dat
1M /data/tpcdsdata/web_site.dat |
There are two main ways to load that data into ADWC: SQL*Loader or the DBMS_CLOUD package. Since I decided to use the latter, I had to load those files into an object cloud service.
I settled to load them into Oracle’s Object Storage with the following command:
$ oci os object bulk-upload --bucket-name tpcdsdata --src-dir /data/tpcdsdata --include "*.dat" |
Since I used the defaults, the load was carried out by ten parallel threads. In case you wonder, it took almost 6 hours and during that time, two CPU cores were fully used.
Once all data was available in Oracle’s Object Storage, to decide how many CPU cores to allocate for the full load, I ran a number of loads of a single table of average size (CATALOG_RETURNS, ca. 22GB) and an increasing number of CPU cores allocated in ADWC. The simplified version of the PL/SQL block I used for one run was the following:
DECLARE
  l_field_list CLOB;
  l_table_name VARCHAR2(128) := 'CATALOG_RETURNS';
BEGIN
  -- get rid of old data
  EXECUTE IMMEDIATE 'TRUNCATE TABLE '||l_table_name;

  -- generate field list
  SELECT listagg(column_name || decode(data_type, 'DATE', ' DATE "YYYY-MM-DD"', ''), ',') WITHIN GROUP (ORDER BY column_id)
  INTO l_field_list
  FROM user_tab_cols
  WHERE table_name = l_table_name;

  -- load data
  dbms_cloud.copy_data(
    schema_name => user,
    table_name => l_table_name,
    credential_name => 'CHRIS',
    file_uri_list => 'https://swiftobjectstorage.eu-frankfurt-1.oraclecloud.com/v1/chris/tpcdsdata/catalog_returns.dat',
    field_list => l_field_list
  );
END; |
The following chart summarizes what I observed:
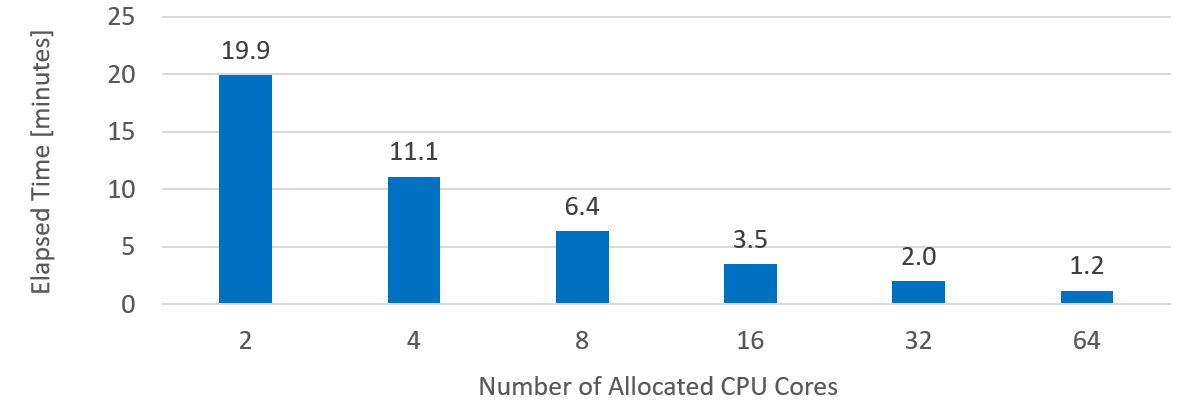
As you can see, as the number of CPU cores doubles, the load time decreased of factor 1.7-1.8. Which, in my opinion, is rather good. Note that I did not test with 128 CPU cores (the maximum ADWC supports), because I was not able to allocate so many CPU cores for a single service.
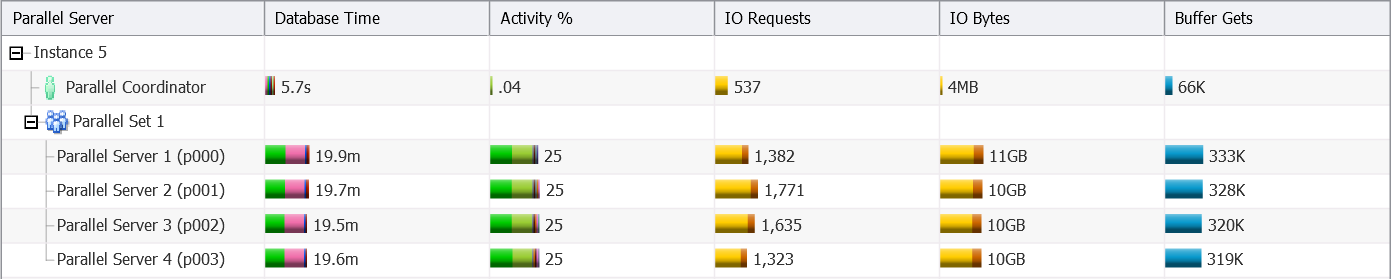
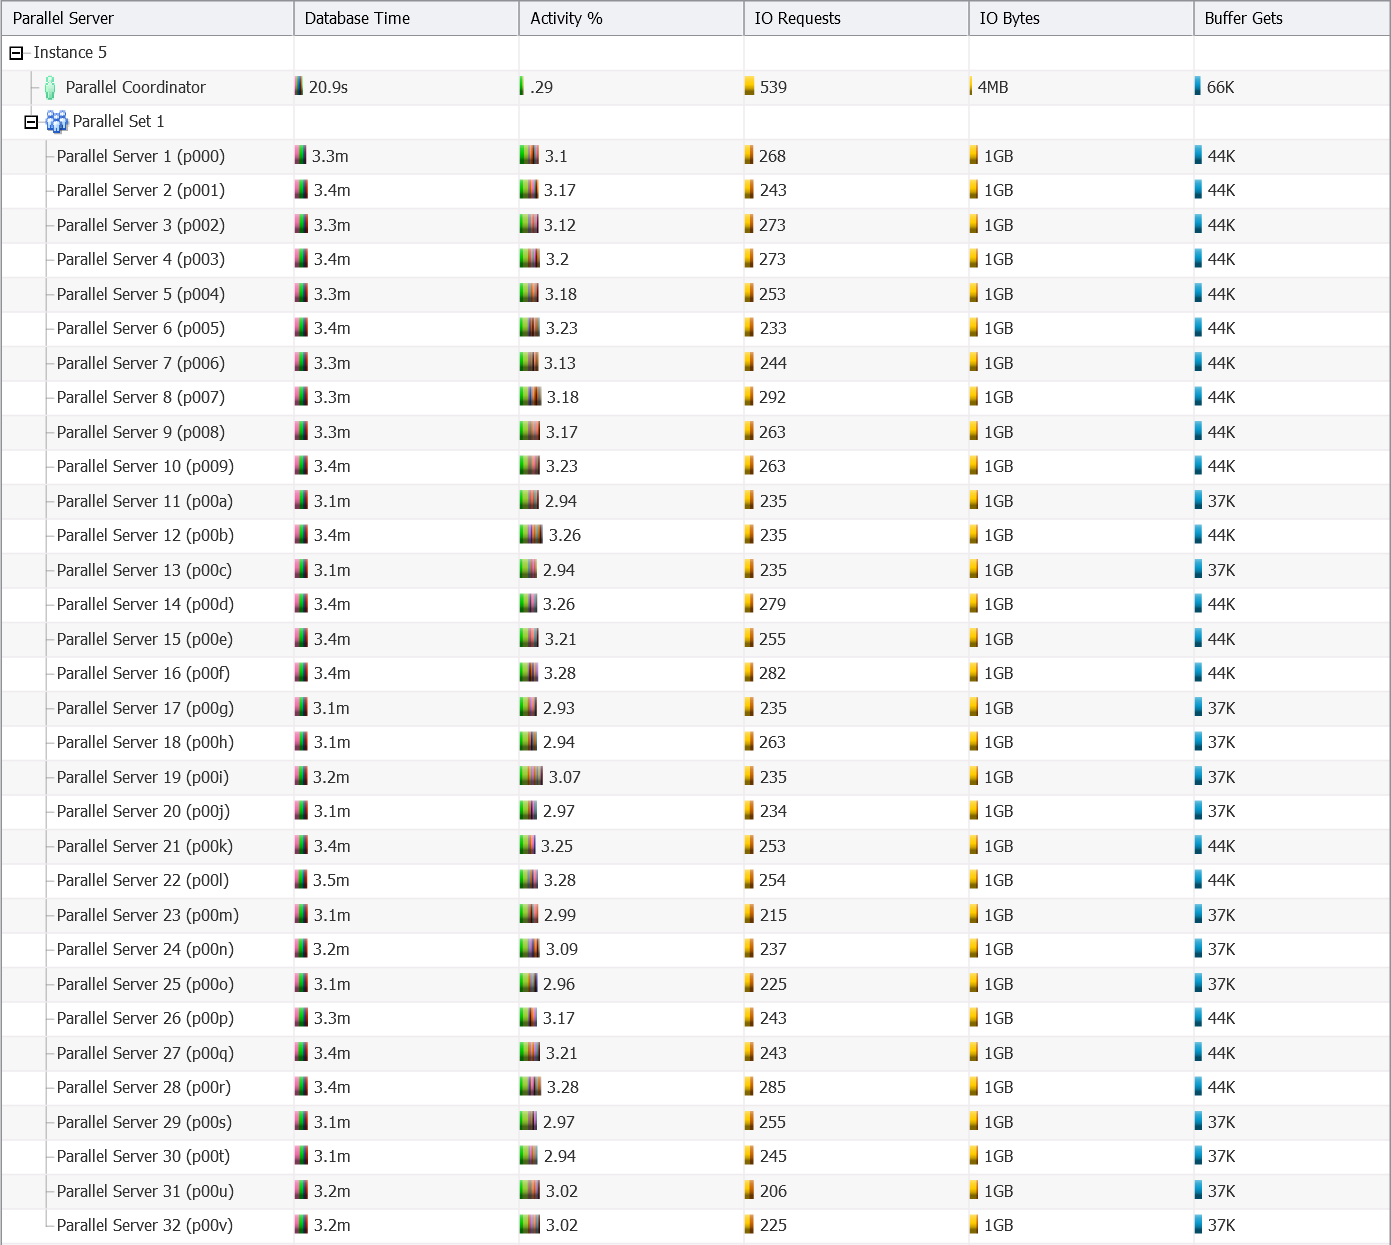
What I found interesting is to have a look at the way the database engine parallelize the loads. By the way, if you are asking yourself how the data is loaded, it is done with a simple SQL statement like “INSERT /*+ append enable_parallel_dml */ INTO “TPCDS1″.”CATALOG_RETURNS” SELECT * FROM COPY$RD0ZOZY5DB25HSH0CB24”. For that purpose, for every load, I generated a real-time SQL monitoring report for the INSERT statement. Here is, for each of them, the information about the parallel execution:
- 2 CPU cores – DOP 4, one instance involved
- 4 CPU cores – DOP 8, one instance involved
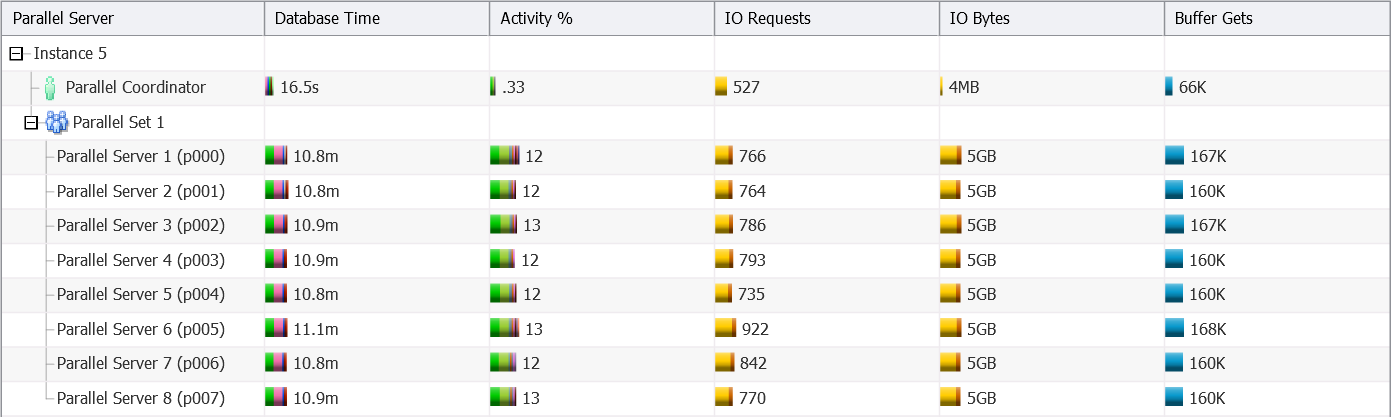
- 8 CPU cores – DOP 16, one instance involved
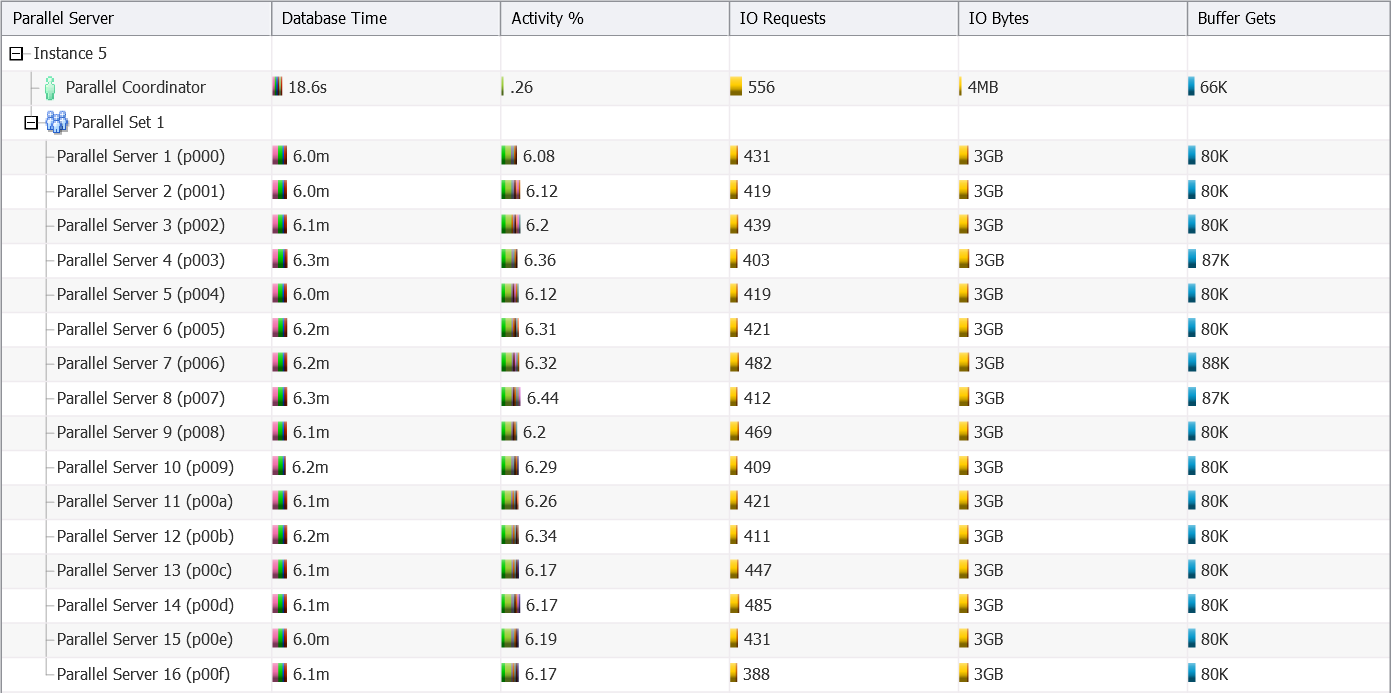
- 16 CPU cores – DOP 32, one instance involved
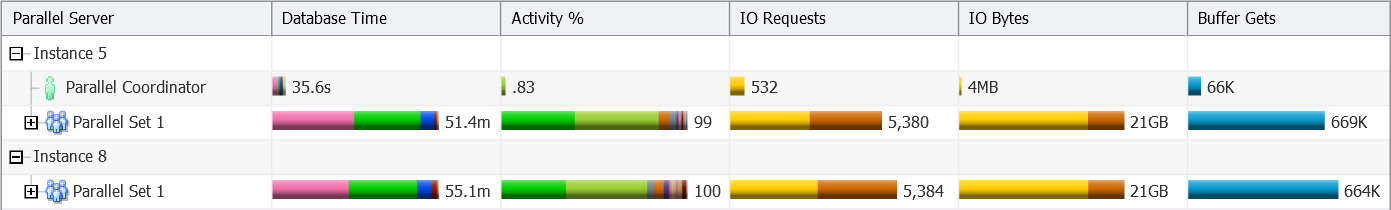
- 32 CPU cores – DOP 64, two instances involved (distribution of parallel execution processes: 32/32)
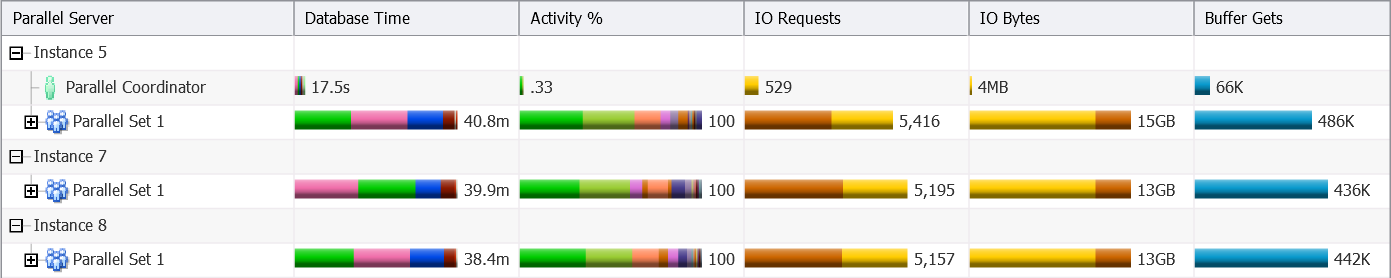
- 64 CPU cores – DOP 128, three instances involved (distribution of parallel execution processes: 43/43/42)
As you can see:
- The database engine selects a DOP which is two times the number of allocated CPU cores.
- Up to a DOP of 32, all parallel execution processes are started on the same instance (5) as the query coordinator.
- With a DOP of 64, half of the parallel execution processes are started on instance 5 and the other half is started on instance 8.
- With a DOP of 128, one third of the parallel execution processes are started on instance 5, another third on instance 7, and the others on instance 8.
- Since the processing is CPU bound and that the number of involved parallel execution processes is two times the number of allocated CPU cores, the Resource Manager kicks in. As a result, a lot of time was spent on the “resmgr: cpu quantum” wait event.
The last test I did was loading the full 1TB of data. The PL/SQL code I used was similar to the one used for the CATALOG_RETURNS table. The only major difference is an additional loop to process all tables/files. With 32 CPU cores allocated, the load took 67 minutes.
In summary, the loads scale well with an increasing number of CPU cores. But, be careful, because of the high DOP, they can also use all CPU resources of the service. It is therefore essential to start them wisely. E.g. by associating them with a sensible Resource Manager group.
Thanks Christian – scales nce when doing the INSERT from files on the object store. Would be great, if you could compare the scan rate in ADW for ordinary tables against an external table on the object-store.
[…] 3. Observations About the Scalability of Data Loads in ADWC […]
[…] Parallel Execution: The query runs in parallel (all the PX operators in the execution plan). This is generally the case in ADWC, except for connections with consumer group LOW or for ADWC configurations with only 1 CPU core. The degree of parallelism (DOP) depends on the number of CPU cores. More details about scalability can be found in Christian Antognini’s blog post Observations About the Scalability of Data Loads in ADWC. […]
[…] data I loaded was the same I used for this blog post (i.e. it is a 1 TB TPC-DS schema). The only difference was that I had to split the input files. […]