Last week I had to analyze a strange performance problem. Since the cause/solution was somehow surprising, at least for me, I thought to share it with you.
Let me start by quickly describing the setup and what was done to reproduce the problem:
- Database version: Oracle Database 11g Enterprise Edition Release 11.1.0.6.0 (64-bit)
- Operating system: Solaris 10 (SPARC)
- To simulate a load job, a simple SQL*Plus script that executes a COPY command is used. Its purpose is to load about 100,000 rows in a table. Let’s call this table T1.
- All modifications in T1 have to be logged into another table. Let’s call it T2. For this purpose, on T1 there are triggers that insert one row into T2 for each inserted, deleted and updated row.
The strange thing was that the rate of the inserts performed by the script decreased over time. In fact, while at the beginning of the processing about 500 rows per second were inserted into T1 (and, therefore, T2), at the end of the processing only about 50 rows per second were processed.
The first thing I did to find out what the problem was is to trace one run by enabling SQL trace. This analysis pointed out that two SQL statements (the ones inserting data into T1 and T2) were responsible for most of the elapsed time. This is not a surprise, of course. The interesting thing was that most of the time was spent on CPU.
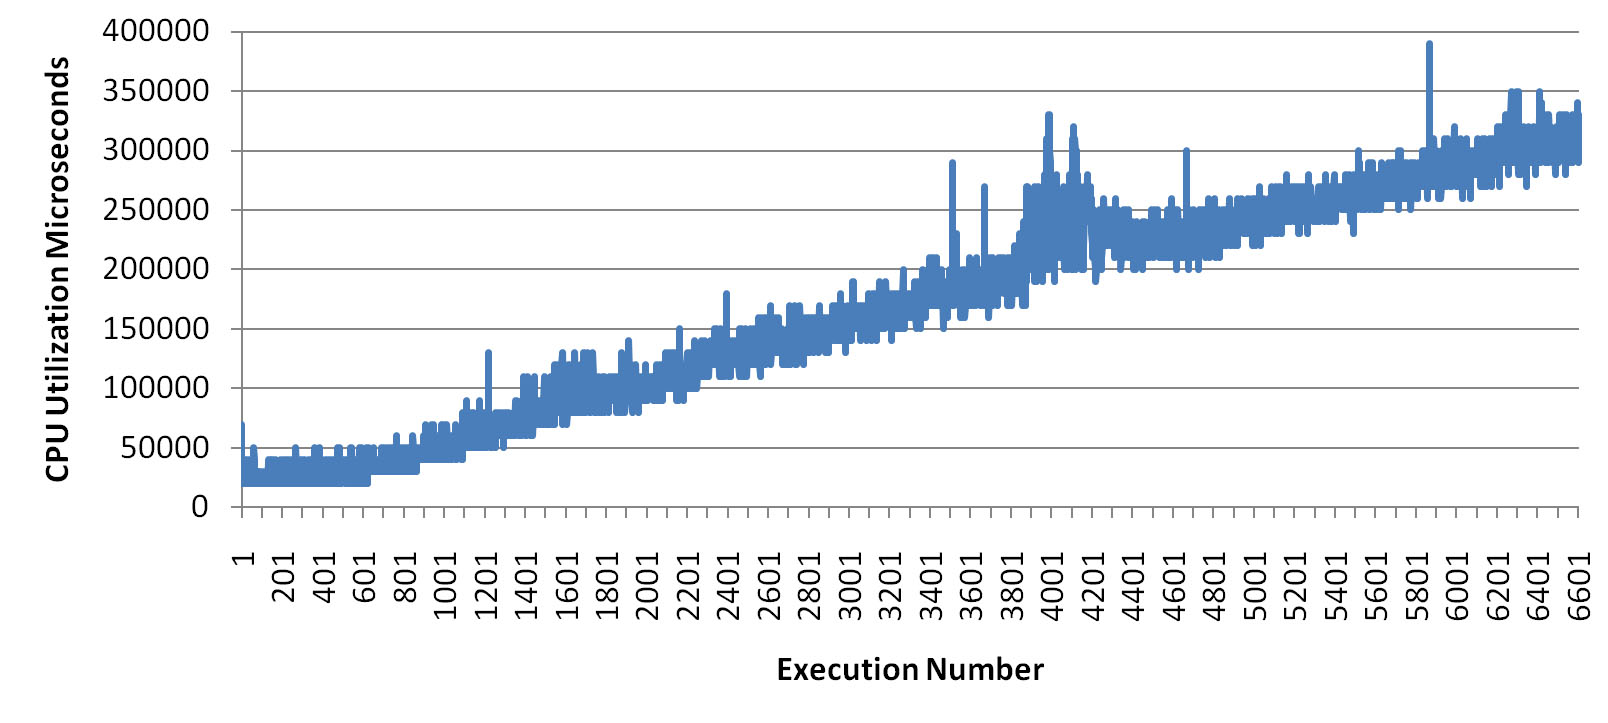
Since the rate of the inserts decreased over time, I extracted from the trace file all the lines providing information about the executions of the INSERT statement on T1 and loaded that data into Excel. Then, I created one chart for each performance figure. From all of them the following, that shows the amount of CPU used for every single execution, was the most interesting. In fact, it shows that while at the beginning of the processing one insert uses about 30 milliseconds of CPU, at the end it uses about 300 milliseconds of CPU for doing the same work. Note that all other charts did not show such a behavior. For example, the number of PIO and LIO were exactly the same at the beginning and at the end of the processing.
Since the trace file was not able to provide further information to investigate the problem, I started looking at V$SESSTAT. The aim was to find another statistic experiencing a similar increase. The search pointed out that the statistic “session uga memory” was also increasing during the processing. In fact, while at the beginning of the processing the session was using about 5MB of UGA, at the end of the processing about 110MB were used. This is strange and, as far as I know, there is no good reason for such a behavior. Hence, it was time to review the code of the triggers. While doing so I noticed, by chance, that a trigger was also available on T2 (the table used to store the log about all modifications). The strange thing was its definition:
CREATE OR REPLACE TRIGGER t2 AFTER INSERT ON t2 FOR EACH ROW
BEGIN
  /* execute the referential-integrity actions */
  DECLARE
    NUMROWS INTEGER;
  BEGIN
    numrows:=1;
  END;
END;
As you can see the trigger does nothing. Apparently, it exists just because triggers are used to implement integrity constraints (something you should avoid, by the way…) and, as a result, they were automatically created for each table. And, in case of T2, there is no constraint to check.
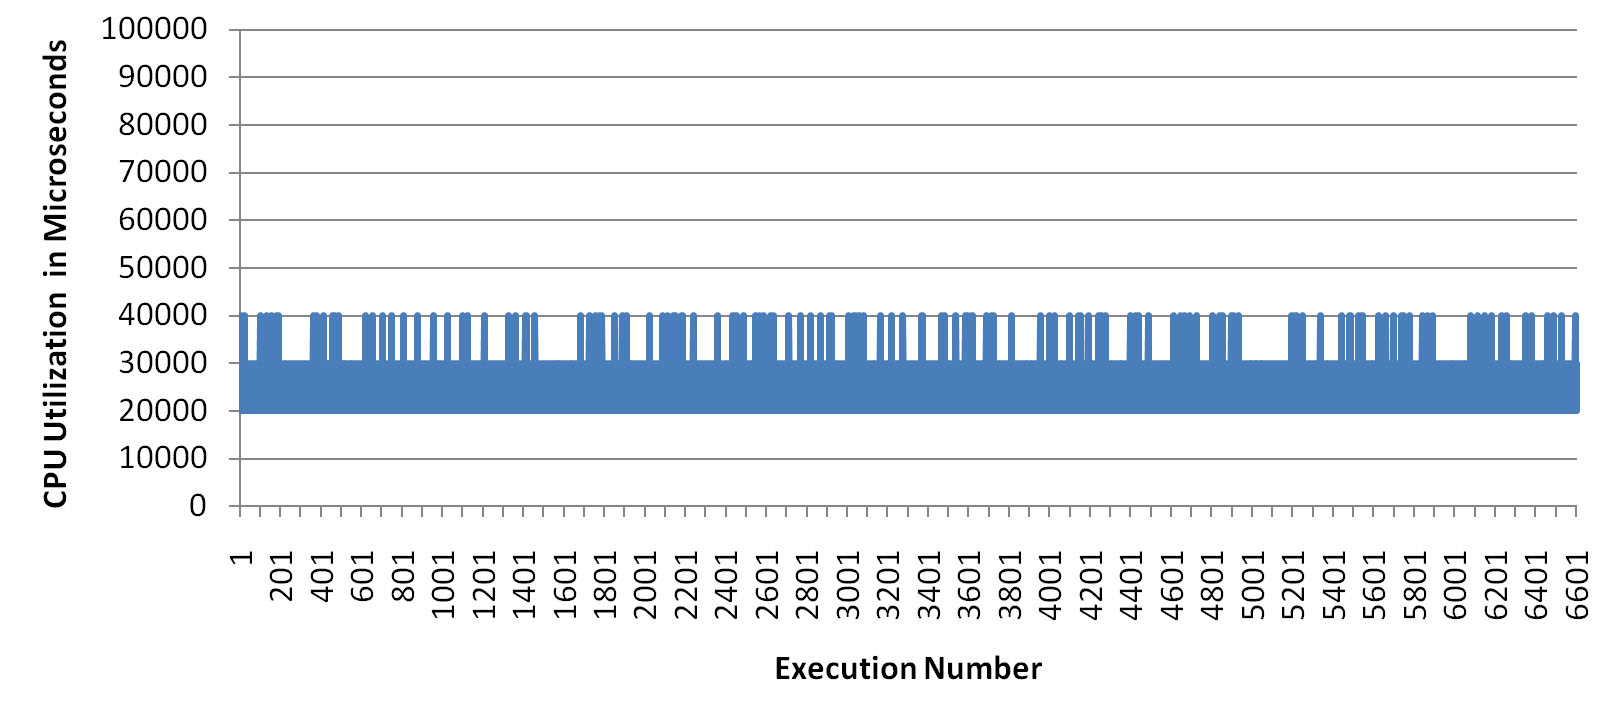
Since the trigger is pointless, I disabled it. After that, surprisingly, it was no longer possible to reproduce the problem! The following chart, created in the same way as the previous one, shows that without the trigger on T2 the CPU utilization is constant during the whole processing.
Therefore, for some unknown reasons, the pointless trigger was the cause of the problem.
By the way, once the trigger was disabled also the UGA memory was no longer increasing. Hence, to me it seems that the customer hit a bug…


Off topic, but I can not resist it.
> it (the trigger) exists just because triggers are used to implement integrity constraints (something you should avoid, by the way…)
No, no, no…
What should be avoided is: triggers that perform DML. Because then things automagically start happening.
Triggers that implement integrity constraints on the other hand, only execute queries: *which is fine*!.
What’s wrong is the trigger on T1: it performs DML…
Just my opinion.
Hi Toon
About triggers and constrains… I only agree with you when the constraint cannot be implemented with a simple foreign key. In other words, when a foreign key can be used the solution with a trigger is a no-go for me.
About DML and triggers… It really depends, there are situations where it is “fine” (or, at least, not that bad). In this case, since the tables are loaded by ETL jobs, it is not good at all.
Cheers,
Chris
Hi Christian,
yes, it’s a bug.
Hi Timur
Thank you for the information. The description matches what we are experiencing…
Cheers,
Chris
Dears,
We should never user triggers to enforce integrity. Because to do so correctly, you
need to lock the table (not at the row level but at the table level).
You know why? because of this fundamental principle of read-consistency : readers do
not block writers and writers do not block readers. In a mutli-user concurency systems
enforcing integrity in triggers is almost wrong.
Instead if you implement an indexed Foreign key (with not null foreign key columns if possible),
then you are 100% sure that your integrity constraint is always validated by Oracle and without any locking
Triggers can also be used to do DML. I have used them very often to log the modifications done on a table.
I have always used insert into values() in this audit triggers.
Regards
Mohamed Houri
Hi All,
I’ve faced a lot of issues with using of triggers incorrectly. Actually the problem is not only in integrity constraint but in supporting whole bussiness rules by triggers. It’s quite often when developers use the triggers as a kind of simplest way to organize the rule support as result tables overgrowns with triggers. The core of the problem is that it’s impossible to manage that kind of integrity constraitns and overgrown leads to large number of locks and even deadlocks in highly concurrent systems. I could call it as triggers’ shower. Another way to get poor perfomance with triggers to use large number of operations in the trigger’s body it’s common as well which seems to be almost the same problem.
Kind regards,
Iliya
[…] 6-Unusual CPU/time consumption during inserts on a table with trigger (scalibility problem related with bug 6400175 in 11.1.0.6) Christian Antognini-Inserts Experiencing an Increasing CPU Consumption […]